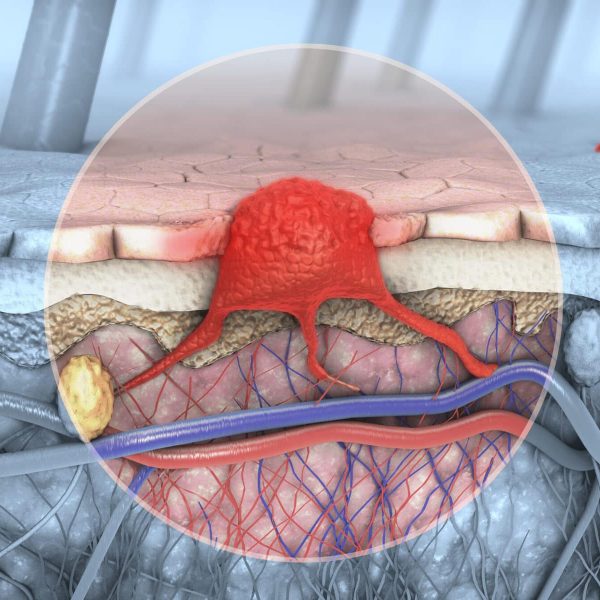
Skin cancer is by far the most common cancer worldwide. While most skin cancers can be treated well if detected early, the determinants of treatment response and relapse are still not fully understood. Furthermore, advanced stages have a high risk of mortality. High-resolution optoacoustic imaging (RSOM) can resolve detailed temporal changes within the tumor microvasculature, revealing neoangiogenesis within the tumor tissue and longitudinal detailed insights into the vascular growth on a microvascular level. In addition, processes immediately after therapy can be monitored, including single vessel occlusion, vascular normalization and ischemic reperfusion – potentially helping to improve skin cancer therapies.
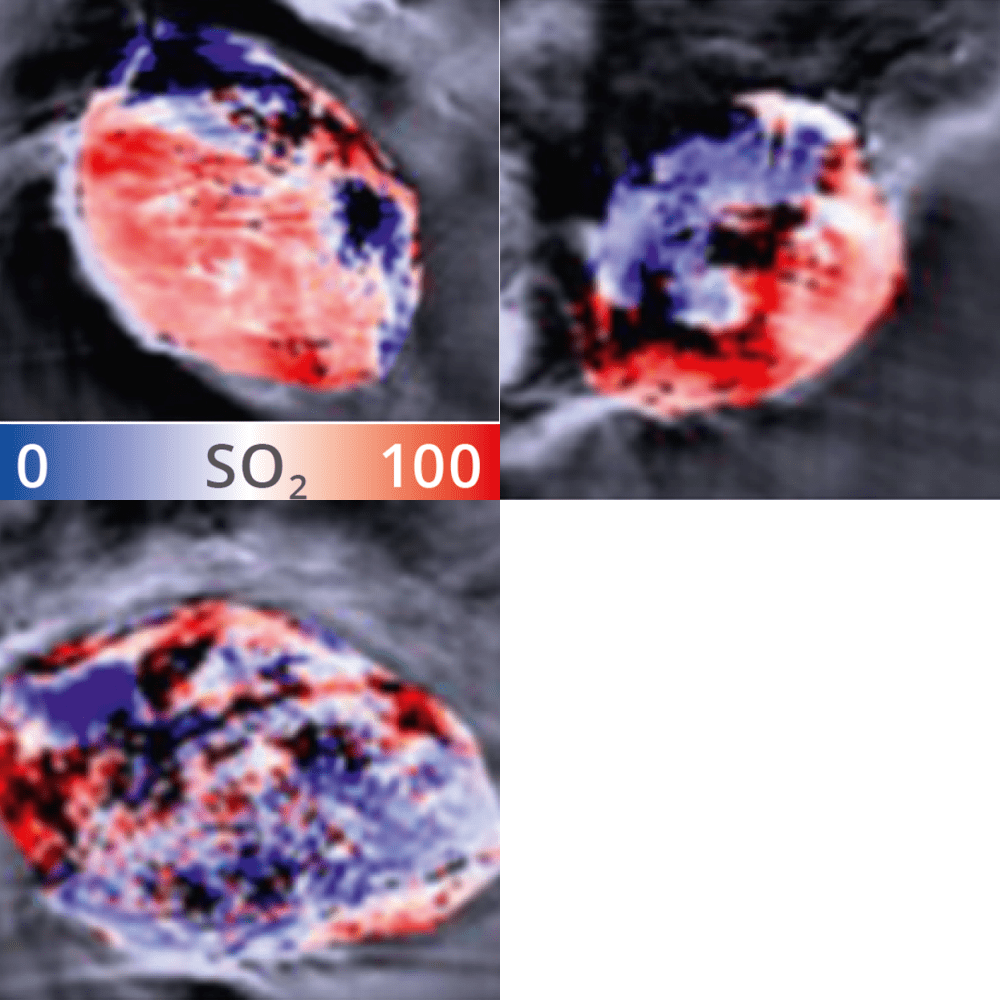
Oxygen saturation measurements in control or tumor-bearing mice before radiotherapy. Animals were stratified according to their eventual degree of response to therapy (control, full responder, partial responder, non-responder).
Tumor oxygen saturation as a predictor of tumor therapy response
Functional MSOT measurements in human head and neck squamous cell cancer (HNSCC) xenografts can predict which animals will respond to therapy. Animals lacking increased MSOT oxygenation signals could be targeted for alternative therapy, or higher doses of radiotherapy.
Martinho Costa et al., Photoacoustics. 2018
Tumor oxygen saturation as an indicator of therapy response
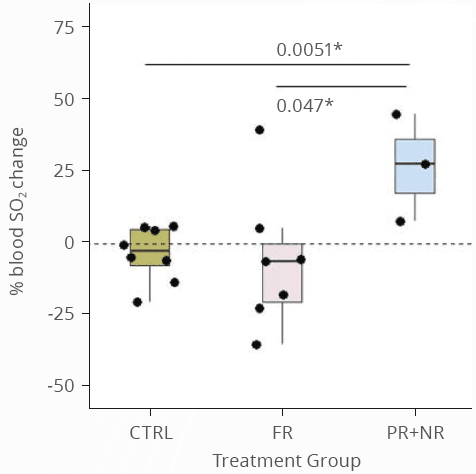
Control animals and those that fully responded to radiotherapy showed no change in oxygenation, while the partial and non-responders showed increases in blood oxygenation after radiotherapy. An increase in oxygenation post-radiation is potentially reflective of angiogenesis that occurs with continued, uncontrolled tumor growth. Thus, MSOT can be used to assess tumor therapy efficacy.
Martinho Costa et al., Photoacoustics. 2018
Percentage change in average tissue oxygen saturation post following radiotherapy. Animals were stratified according to their therapy response as assessed by caliper measurements (control, full responder, partial responder, non-responder).
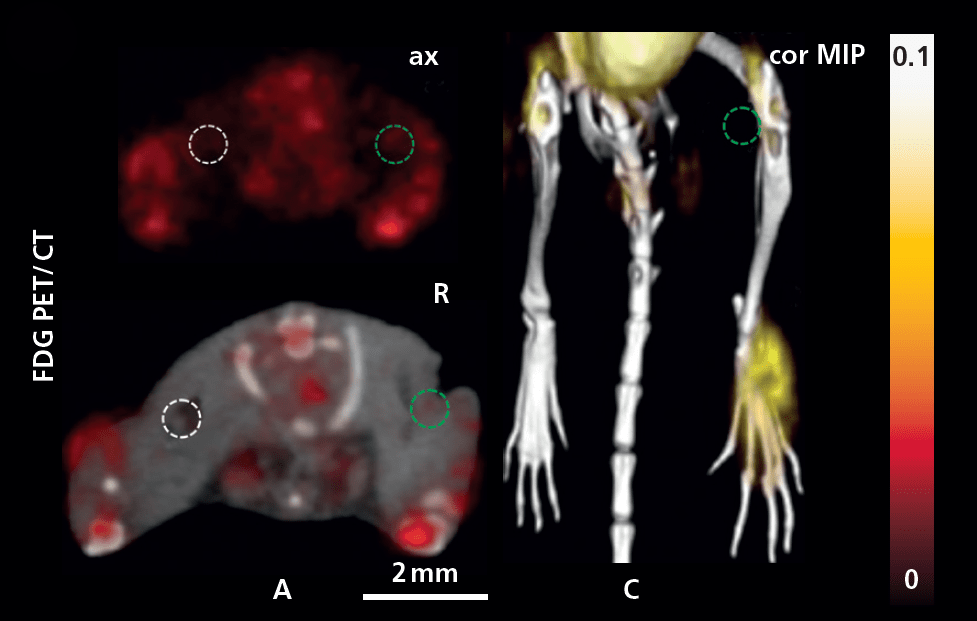
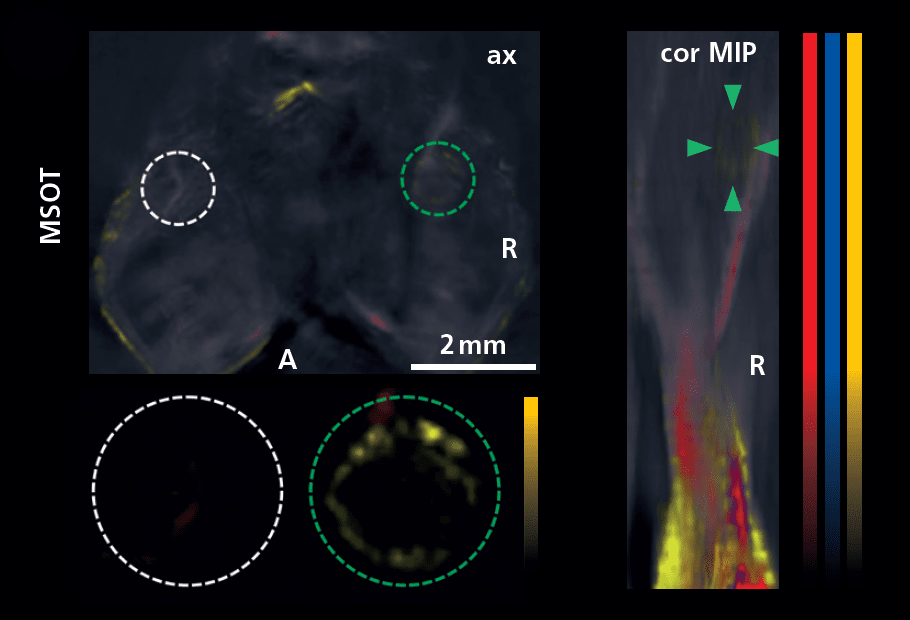
MSOT contrast showing a single wavelength image in greyscale, deoxyhemoglobin in blue, oxyhemoglobin in red, and melanin in yellow. MSOT images are compared with FDG-PET/CT.
Detection of melanoma micrometastasis
MSOT can sensitively detect tumors in melanoma without contrast enhancement due to the optical excitation of melanin. Whereas the melanin-based MSOT detection showed metastases at early time points, these metastases were invisible to FDG PET.
Neuschmelting et al., Radiology. 2016
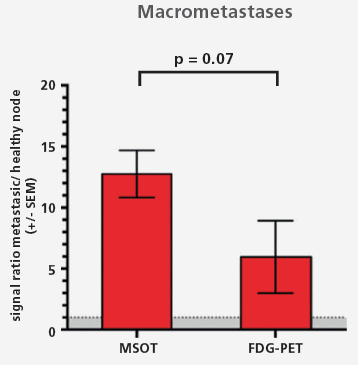
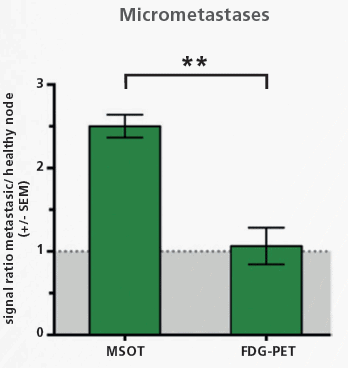
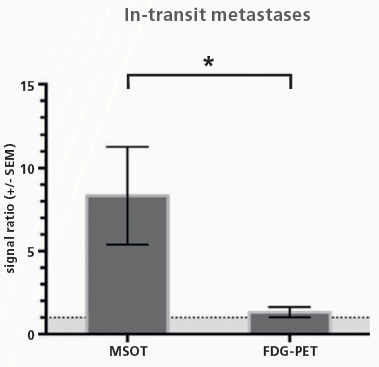
MSOT is more sensitive to melanoma metastasis than PET
Both MSOT and FDG-PET distinguished melanoma macrometastases, although MSOT imaging demonstrated a higher contrast enhancement relative to control, as compared to PET. However, only MSOT imaging identified the micrometastases and in-transit metastases, as PET failed to distinguish between the metastases and control tissue. FDG-PET showed no signal enhancement for in-transit metastases, while MSOT showed an 8-fold increase in contrast.
Neuschmelting et al., Radiology. 2016
Quantitative inter-modality comparison of metastasis detection. Metastases were divided into three categories: macro-, micro- and in-transit metastases. The baseline for quantification was determined in the non-tumor bearing hind limb.